안녕하세요, 오늘은 Chart.js 라이브러리를 사용해서 복합 그래프 (Mixed Chart) 를 그려보겠습니다.
이번 포스팅은 12월 17일자로 업로드 된 'Chart.js 라이브러리 사용해서 막대 그래프 그리기' 포스팅과 이어지는 내용입니다.
앞선 포스팅에서는 막대 그래프를 그렸고, 오늘은 그 위에 라인 그래프를 추가하겠습니다.
예제에 나와있는 라인 그래프 옵션 외에도 여러 가지가 있으므로 아래 링크를 참고해주세요.
https://www.chartjs.org/docs/latest/charts/line.html
Line Chart | Chart.js
Line Chart A line chart is a way of plotting data points on a line. Often, it is used to show trend data, or the comparison of two data sets. const config = { type: 'line', data: data, };const config = { type: 'line', data: data, }; const labels = Utils.mo
www.chartjs.org
그리고 Mixed Chart 에 관한 내용은 아래를 참고했습니다.
https://www.chartjs.org/docs/latest/charts/mixed.html
Mixed Chart Types | Chart.js
Mixed Chart Types With Chart.js, it is possible to create mixed charts that are a combination of two or more different chart types. A common example is a bar chart that also includes a line dataset. When creating a mixed chart, we specify the chart type on
www.chartjs.org
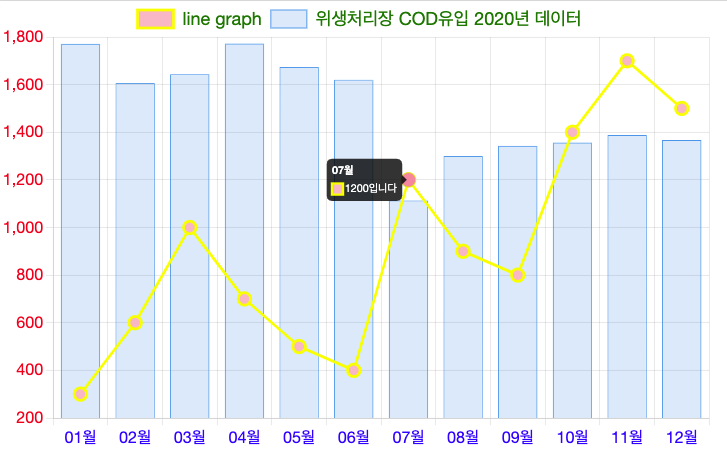
구현된 그래프입니다
전체 예제 코드입니다.
<!DOCTYPE html>
<html>
    <head>
        <meta charset="UTF-8">
        <meta name="viewport" content="width=device-width, initial-scale=1.0">
        <meta http-equiv="X-UA-Compatible" content="ie=edge">
        <title>Chart.js 막대, 라인 그래프</title>
        <script src="https://cdn.jsdelivr.net/npm/chart.js@3.9.1/dist/chart.min.js"></script>
        <style>
            * {
                margin: 0;
                padding: 0;
                box-sizing: border-box;
            }
            div {
                width: 800px;
                height: 500px;
            }
        </style>
    </head>
    <body>
        <div>
            <canvas id="myChart" width="800" height="500"></canvas>
        </div>

        <script>

            const serviceKey = "발급받은_서비스키"
            const url = `http://apis.data.go.kr/6260000/BusanTblSwgqtyStusService/getTblSwgqtyStusInfo?ServiceKey=${serviceKey}&pageNo=1&numOfRows=1&resultType=json`;

            function getData(){
                const response = fetch(url);
                return response.then(res => res.json());
            }

            async function exec(){

                try {
                    const json = await getData();
                    const data = json.getTblSwgqtyStusInfo.body.items.item[0];
                    console.log(data);

                    const ctx = document.getElementById('myChart').getContext('2d');
                    const config = {
                        data: {
                            labels: ['01월', '02월', '03월', '04월', '05월', '06월', '07월', '08월', '09월', '10월', '11월', '12월'],
                            datasets: [
                                // 막대 그래프
                                {
                                    type: 'bar',
                                    label: data.gubun + " " + data.category + " " + data.swYear + "년 데이터",
                                    data: [data.jan, data.feb, data.mar, data.apr, data.may, data.jun, data.jul, data.aug, data.sept, data.oct, data.nov, data.decem],
                                    backgroundColor: 'rgba(54, 162, 235, 0.2)',
                                    borderColor: 'rgba(54, 162, 235, 1)',
                                    borderWidth: 1,
                                    order: 2
                                },
                                // 라인 그래프
                                {
                                    type: 'line',
                                    label: 'line graph',
                                    data: [300, 600, 1000, 700, 500, 400, 1200, 900, 800, 1400, 1700, 1500],
                                    borderColor: 'yellow',
                                    backgroundColor: 'pink',
                                    borderWidth: 3, // 선 두께
                                    pointRadius: 7, // 포인트(동그란거) 지름 길이
                                    pointHoverRadius: 8, // 포인트에 마우스 올렸을 때의 지름 길이
                                    order: 1 // 라인 그래프를 막대 그래프 위에 보이기
                                }]
                        },
                        options: {
                            scales: {
                                x: {
                                    ticks: {
                                        font: {
                                            size: 18,
                                        },
                                        color: "blue"
                                    }
                                },
                                y: {
                                    beginAtZero: false,
                                    ticks: {
                                        font: {
                                            size: 18,
                                        },
                                        color: "red"
                                    }
                                },
                            },
                            plugins: {
                                // 툴팁 (바 그래프에 마우스를 올리면 나타나는 것)
                                tooltip: {
                                    callbacks: {
                                        label: function(context) {
                                            if (context.datasetIndex === 0) { // 막대 그래프쪽
                                                let label = context.dataset.label || '';

                                                if (label) {
                                                    label = 'COD유입:';
                                                }
                                                if (context.parsed.y !== null) {
                                                    label += context.parsed.y.toString();
                                                }
                                                return label;

                                            } else if (context.datasetIndex === 1) { // 라인 그래프쪽
                                                return context.parsed.y + "입니다";
                                            }
                                        }
                                    }
                                },
                                // 범례
                                legend: {
                                    labels: {
                                        font: {
                                            size: 20
                                        },
                                        color: "green"
                                    }
                                }
                            }
                        }
                    }
                    const myChart = new Chart(ctx, config);
                }
                catch(error){
                    console.log(error);
                }
            }

            exec();


        </script>

    </body>
</html>'JavaScript' 카테고리의 다른 글
| [javascript] classList를 사용한 커스텀 select 메뉴 만들기 (0) | 2023.01.10 |
|---|---|
| Day.js를 활용하여 날짜 및 시간 조작 (0) | 2023.01.01 |
| [JavaScript] 별점 드래그 기능 만들기 (0) | 2022.12.21 |
| [ JavaScript ] Chart.js 라이브러리 사용해서 막대 그래프 그리기 (0) | 2022.12.17 |
| [ JavaScript ] moment.js 라이브러리 사용해보기 (0) | 2022.12.11 |


